

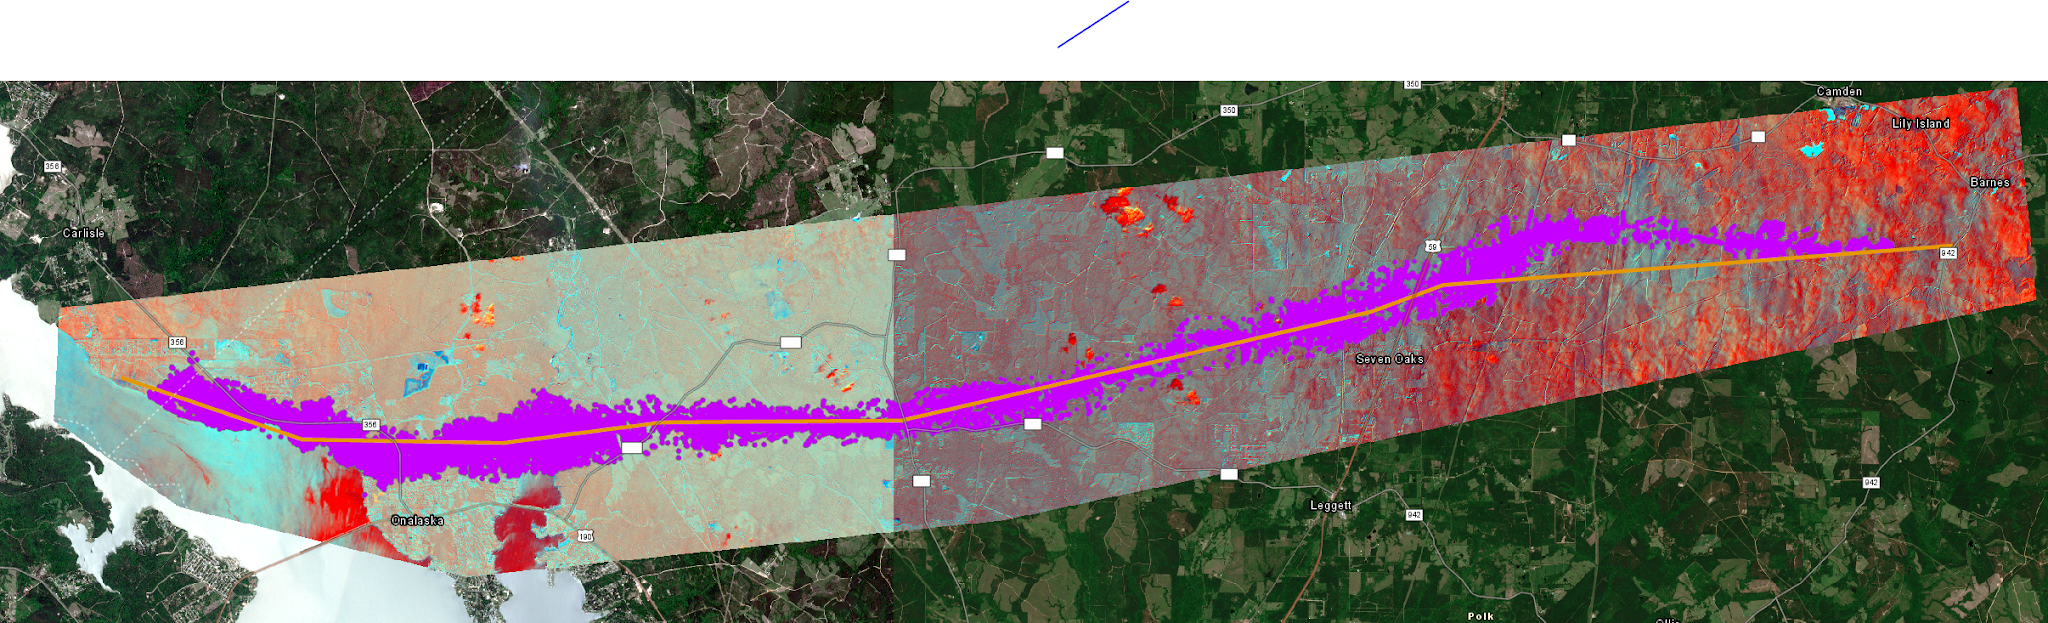

Tornado Derived Swath and Damage Proxy: Multispectral Imagery
Client: FEMA Regional Geospatial
Year: 2020
Project: Needed the ability to estimate the number of buildings impacted by a tornado while FEMA waits for the authoritative National Weather Service Swath. It was proven that Sentinel and Planet Imagery were vital data sources for servicing swaths and detecting levels of damage.
Role: Remote Sensing Developer


Review of Remote Sensing Applications for Monitoring Hazardous Waste
Client: FEMA Regional Geospatial
Year: 2019
Project: Concerned with hazardous material, pollutants, and Contamination status. How can we use remote sensing to help prioritize clean-up, monitor, and report on stabilization?
Results: Developed a texture-based algorithm for NOAA imagery when debris information from crowdsourcing wasn’t available or Object Features Extraction Tool N/A due to time and accessibility. (ENVI)
Role: Remote Sensing Developer


Wildfire Damage Proxies Derived from Multi-Spectral Imagery
Client: FEMA Regional Geospatial Office and FEMA Region 9
Date: 2020-2021
Audience: During the response stage, FEMA needed to estimate the number of buildings affected by wildfires, predict movement, and categorize damage into four levels (Destroyed, Major, Minor, and Affected). Smoke can move quickly and unpredictably.
Role: Litterature Review to test several indices that capture burn and fire service so that the end result shows areas that have been burned, untouched, and currently have active wildfires.
Software/Data: Sentinel 2 Imagery, FEMA Damage Assessments, NBR2 Index
Real-Time Flood Derived Extent Application for USA Extent: VIIRS FloodFraction 30m
Client: FEMA Regional Geospatial
Date: 2020
Project: Turn NASA’s 30-meter daily flood fraction product into a service that could be accessed through a web application and estimate the location and county of potential buildings, etc, in real-time. The first real-time flood exposure product was implemented for the FEMA RGO.
Software/Data: VIIRS Flood Fraction, ESRI Web App Builder
Role: Automating the workflow pipeline from the Joint VIIRS source to the web application interface.
Audience: Response Office that needs to send personnel, commodities, and teams into the field. Buildings Impacted Estimates are the first information they need.

FEMA Imagery Data Management Initiative: ESRI Imagery Applications for Disaster Response:
Hosting, Indexing, Processing, Sharing, and Exploitation
Client: FEMA Regional Geospatial Office
Date: 2020-2021
Problem: The client needs a cloud system to store, share, exploit, process, and task imagery for the response phase of disasters between the FEMA Teams and other interagency partners.
Role: Evaluation of the ESRI IDM system for the client and implementation of components related to processing the image services, ESRI Workflow to task imagery, pre-processing, and pushing image titles.


Flood Awareness Apex Maximum Flood Extent Delineation National - 25-Year Landsat Library
Client: MAXAR (Previously known as MDA Information Systems)
Year: October 2017
Audience: FEMA APEX Program
Project: Create an operational comprehensive flood extent for all of the United States using the USGS Landsat Archive Library and Direct Surface Water Extent Indice.
Role: Research published literature and spectral-based algorithms to develop an optimized surface water (flood) extent index and workflow. Assisted in writing a white paper on technology, data collection, and methodology practices. Identified dates of AOI’s highest peak flood from research and collected and prepared hydraulic and environmental data areas using R and Excel functions to notice peak trends in stream gauges. Validated results using Confusion Matric against High Water Marks. Requires extensive knowledge of FEMA’s FIRM and National Flood Hazard Layer. Participated in weekly meetings, presentations, and status updates for critical stakeholders to clarify project progression.


Mapping the Great Barrier Reef Intertidal Zone 30-Year Change
Client: College of Science and Engineering, James Cook University
Year: October 2017
Role: Assisted in the research and testing of the DSWE Model, which created a geospatial product that captures accurate shoreline, permanent land, permanent water, and intertidal zones of NW Australia coastlines from Landsat Archive imagery 30 years and changes over time. Analyzed model’s results to determine the best high- and low-water masking parameter thresholds to capture tidal zones for best accuracy and precision outputs.
Literature Review:
https://landsat.gsfc.nasa.gov/article/welcome-to-the-intertidal-zone-mapping-australias-coast-with-landsat/
https://www.sciencedirect.com/science/article/pii/S0272771418308783?via%3Dihub


Visual Navigation and Land Use Land Cover VISNAV - LULC
Client: The work was specifically developed to suit the National Geospatial-Intelligence Agency's (NGA) requirements for global-scale planning and terrain mobility solutions.
Year: 2016
Project: Produced unsupervised learning techniques on 5-meter and 30-meter land cover maps derived from VISNAV_HD 5 and Enhanced Land Cover Landsat 30-meter imagery to be used for global-scale planning and terrain mobility products for NGA clients.
Role: Developed unsupervised learning techniques for 5-meter and 30-meter land cover maps. Data sources include VISNAV_HD 5 and Enhanced Land Cover Landsat 30-meter images.
Image Interpretation: Spatial analytic methods were used to evaluate multispectral photography's spectral properties and patterns.
Differentiated and classified 13 separate land cover classes.
To validate the classification accuracy, I used Google Earth Pro.
Knowledge Applications. ISO-compliant standards were followed to ensure high-quality and consistent results.
Audience: Created global-scale planning and terrain mobility products for an NGA client.
Remote Sensing Roles:

UAE Dubai Geomorphology Shoreline Delineation and Measuring Shoreline Change
Project: Define Dubai's shoreline and analyze 20 years of changes. A comprehensive approach is needed to integrate Landsat Enhanced Thematic Mapper (ETM) imagery library stack with improved ERDAS change detection algorithms. The goal is to comprehend Dubai's changing coastline landscape over 20 years.
Role: Process Landsat ETM imagery library stack from two decades efficiently. Temporally resolve shoreline change data. Effectively use advanced change detection techniques in ERDAS. Systematically analyze Dubai's shoreline evolution over 20 years using Landsat ETM data's temporal resolution.
Spatial Analysis: Find tiny changes in coastline, land-water interfaces, and sediment deposition. Discover the spatial extent of shoreline alterations to comprehend the region's geomorphic dynamics. Use change detection results to gain insights into Dubai's coastline morphology drivers.
